Our technical graphics are truly a work of art. We take your data and create a visual all can understand.
Onshore Cutaway Diagrams
Onshore Cutaway Diagrams
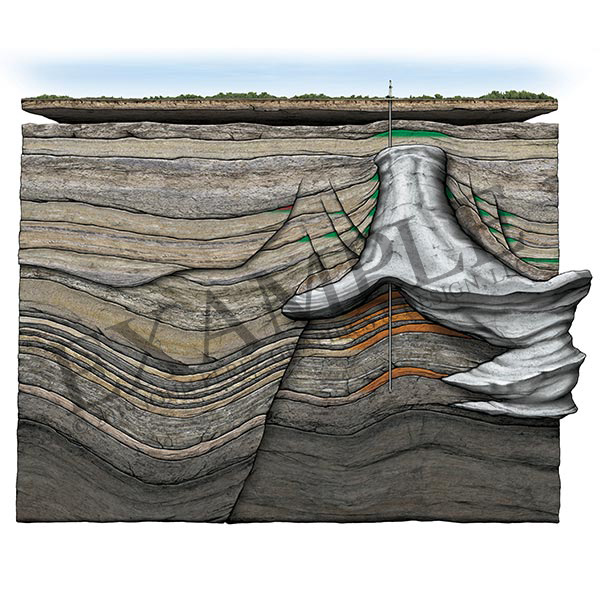
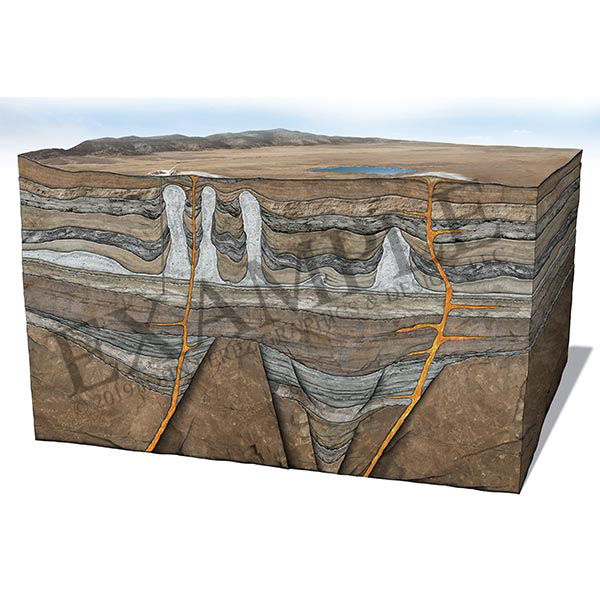
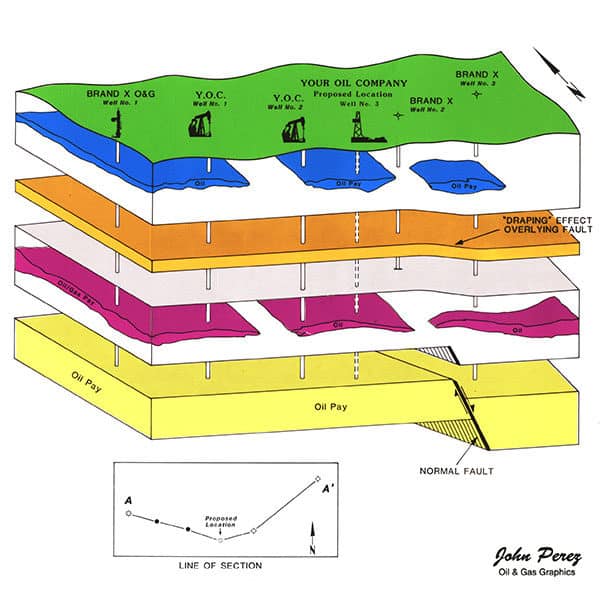
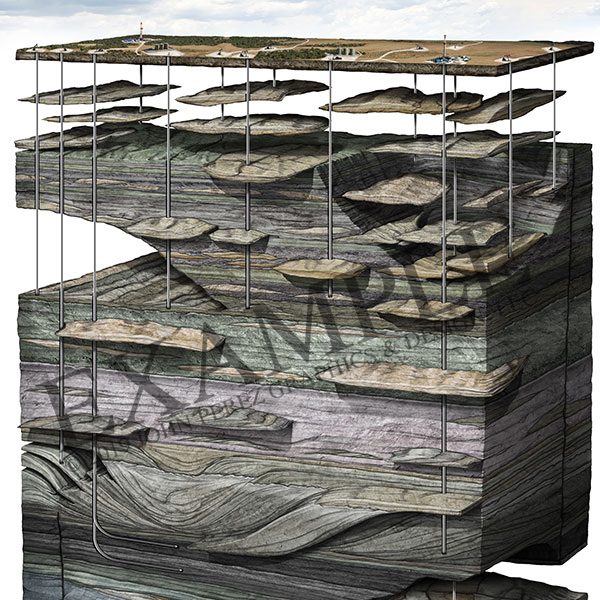
Our signature oil and gas graphics product was born from the need to show the layperson, oil and gas investor or executive what the geologist’s, geophysicist’s and engineer’s data reveals to them. With our GEOART, no two cutaway diagrams are alike, just as no two geologic features or prospects are the same. Let us tell your unique story.
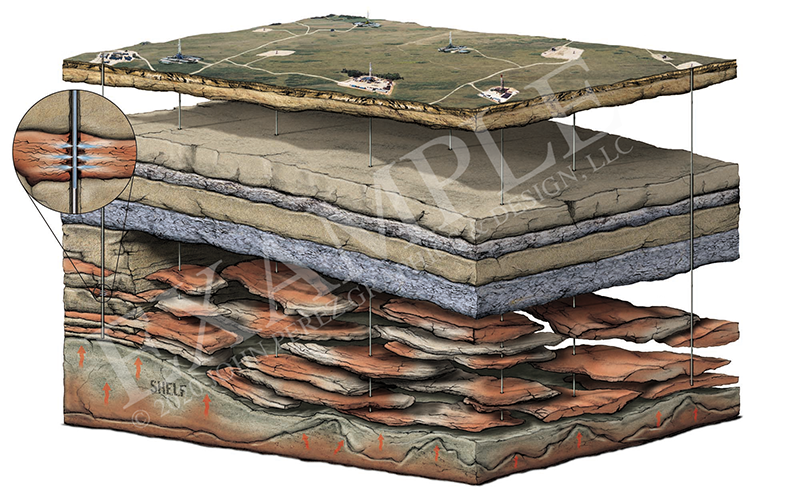 | 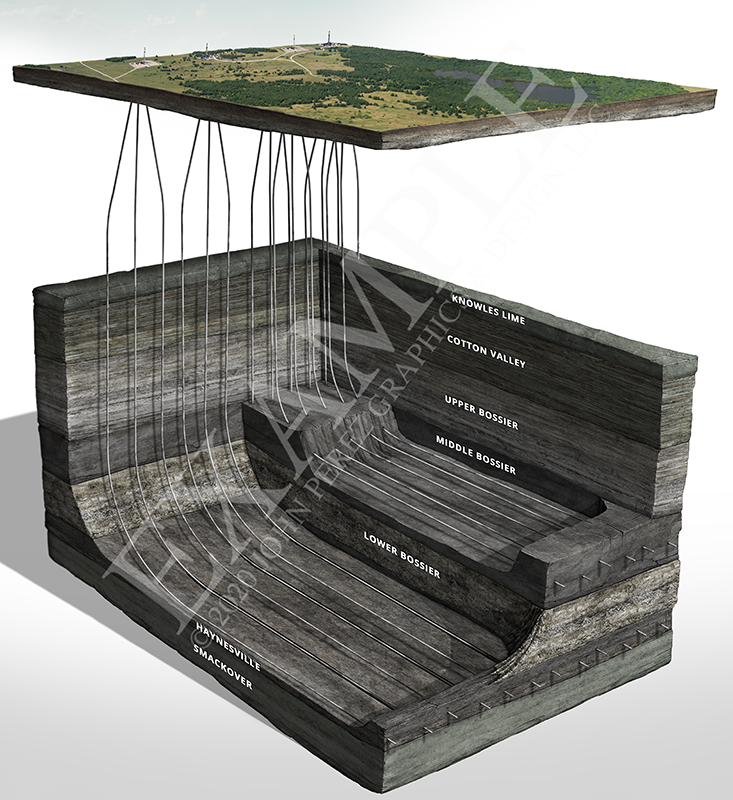 | 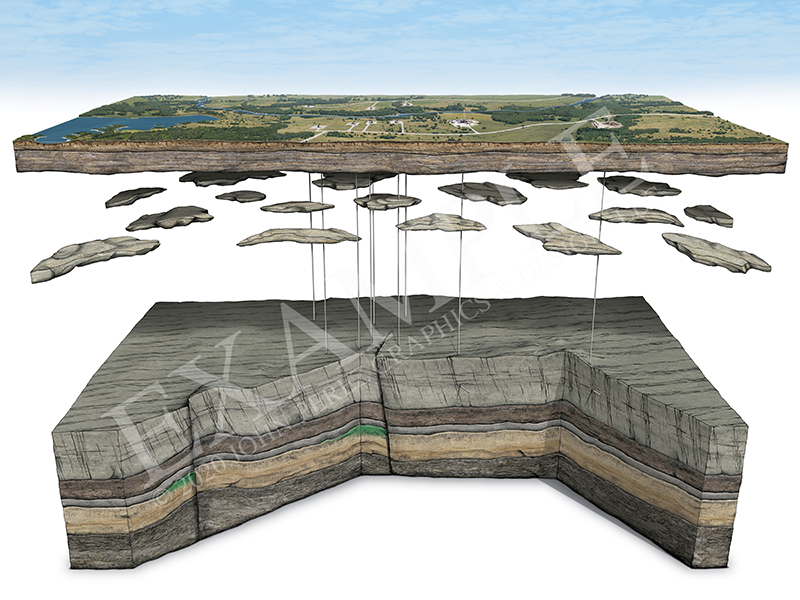 |
East Texas Basin and North Louisiana Salt Basin | Cotton Valley - Bossier Shale – Haynesville - SmackoverOur GEOART cutaway diagrams have been uniquely designed and tweaked to make sure each and every technical graphic has a purpose to show simple and complex geology. | Upper Jurassic / Lower Cretaceous – 156 to 145 (mya - Age)If you need that extra something to bring your technical data to life, then our team can create some of the best eye catching cutaway diagrams around. |
Custom Cutaway Diagrams. No hand-holding needed.
With our experience in the oilfield, we understand your visual needs. Our background isn’t just sitting behind a computer and copying someone else’s work. We have worked at refineries, on rigs and chased seismic trucks in the middle of nowhere. Been there, done that. We are the innovators, the creators. Our work is cutting edge.
So whether it’s an idea, chicken scratch on a napkin, seismic or geologic data, we can turn any of these sources into a compelling, easy to understand illustration.
That’s what we do.
We weren’t kidding about the napkin drawings…
Consider us your native interpreters. We understand the geology. We understand the science. And we understand the petroleum industry.
Your data might look like a ragged pattern of black and white lines to most people. Not to us. You don’t have to hold our hand. Our clients know that, and so they often just hand us a chaotic mix of data and say: “Work your magic.” Our response?
That’s what we do.
Move vertical bar across images to see comparison

Pioneers then. Leaders now.
Even though it’s been a while, not much has changed. Sure, we don’t use ink and Mylar so much anymore.
But our clients still need to turn their data into jaw-dropping, easy to understand visuals.
And we still lead the industry in creating the most accurate and visually compelling schematic illustrations out there.